My Hacintosh Experiment
Previous: Performance
Benchmarking...
Performance Tweaks
Memory Tweaks
Curious to increase the performance a little bit, another 2GB stick of DDR3 matched memory was installed into the motherboard's second DDR3 slot, bringing total memory to 4GB and enabling Dual Channel Interleaving. Xbench was run seven consecutive times on each of the 2GB and 4GB setups, the results averaged for each, and compared:
(Cilck image for larger version)
Memory Speed Issue
After adding the second memory stick and running the above test, I
noticed Apple's System Profiler
reporting "4GB of 1066MHz DDR3" memory instead of 1333MHz memory. This
was confirmed by Gigabyte's BIOS settings in the "MB Intelligent
Tweaker" panel: The "Memory Frequency" setting displayed "1333 1066",
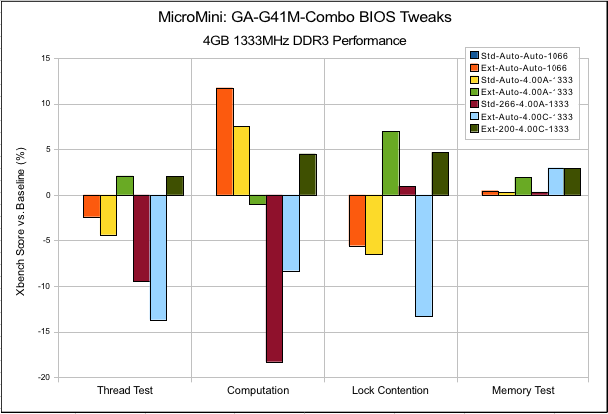
indicating the 133MHz memory was being run at 1066MHz.Wanting to have the system run the memory at it's rated speed of 1333MHz, I used the tweaker panel to vary the Performance Enhancement, (G)MCH Frequency Latch, and System Memory Multiplier (SPD) values, re-ran Xbench, and documented the change in performance for a number of combinations of these three parameters:
(Cilck image for larger version)
- Performance Enhance = Extreme
- (G)MCH Frequency Latch = 200MHz
- System Memory Multiplier (SPD) = 4.00A (or, 4.00 @ 266MHz FSB)
- Memory Frequency (MHz) = 1333 1333 (or, the DDR3 RAM rated at 1333Mhz was being run at 1333MHz)
PCI-Express Frequency Increase
The video card installed in the motherboard's PCI-Express slot runs at
a default frequency of 100MHz. Increasing the frequency may
provide faster performance, but with a greater risk of video
instability: Eventually, the video will start to exhibit
artifacts, and in
the extreme the computer may not startup. The video tests within Xbench were run seven consecutive times on the default setting and the results averaged to establish baseline performance. Randomly increasing the PCIe Frequency to 108MHz via the "MB Intelligent Tweaker" panel resulted in a computer that failed to boot. After waiting for the BIOS to automatically recover and reboot, the PCIe Frequency was lowered to 104MHz and the computer booted normally.
Xbench testing was repeated for this new setup and then compared to the baseline:

(Cilck image for larger version)
Xbench Score Variability
Of note, during the Xbench testing the Thread Test scores
seemed to vary greatly from run to run despite the same hardware and
BIOS
setup. The results from the baseline 4GB memory configuration,
discussed above, were typical of those seen during all Xbench testing:
(Cilck image for larger version)
Geekbench
Satisfied with the MicroMini setup for now, I re-ran Geekbench:

Next: Stress Tests