My Hacintosh Experiment
Previous: Performance
Benchmarking...
Stress Testing:
Although I'm sure all the components are well-built (and
guaranteed!),
I'm also curious to check out how the MicroMini behaves under stress.
Two separate tests were run to quantify its performance limits: One
subjective, the other objective.Test #1: Chess.app
In this test, the Chess program included
with Mac OS X is launched and a computer-vs-computer game is run
repeatedly to see how many games the computer can complete without
stalling or freezing. Before each new game, the level of "Strength" in
the Preferences, corresponding to the number of moves ahead the
computer considers before making its' next move, is increased: The
higher the strength, the more CPU-intensive the game becomes. As an
added bonus, you can watch the computer play against itself.| Computer Plays: | Fastest | Default | 75% | Strongest |
| Completion Ratio: | 4/4 | 4/4 | 4/4 | 1/1 |
| %-Completed: | 100% | 100% | 100% | 100% |
In general, the "Fastest" games finished in about ten minutes, while the "Strongest" game required about five minutes per move, or over five hours to complete the game. I think I'll save any further testing of the "Strongest" setting for later!
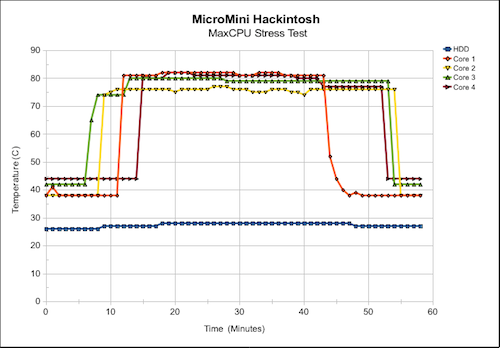
Test #2: MaxCPU
| NOTE: The Mac OSX version of MaxCPU is no longer available. The Windows version is still available here. |
For this test, after powering on the MicroMini:
- The computer was left on for an hour to establish baseline
temperature
levels.
- Preferences for Screen Saver and Enery Saver were set to "Never" to prevent Sleep.
- The applications "Activity Moniitor" and "Temperature Monitor" were launched.
- The "Start MaxCPU" Automator Action was launched.
- After about 37 minutes, the test was stopped by launching "Stop MaxCPU".
- When the CPU temperatures returned to the baseline, temperature
data was exported from "Temperature Monitor" & plotted.
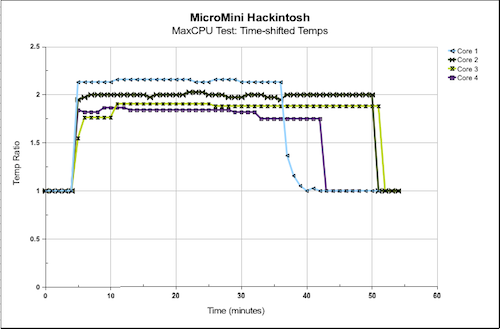
To make comparisons a little easier, the results were normalized by calculating temperature ratio for each core (T/Tmax) and time-shifting all cores to start at the same time:
|